When we were writing about problems with definitions last September (https://rtsunsw.home.blog/2019/09/26/definition-problems/), I honestly thought I would not have to revisit the issue of grid-forming and grid-feeding converters.
However, things have become worse as for some reason some part of the (non-power electronics) industry has started referring to grid-supporting, and in some occasions even grid-forming converters, as voltage source converters.
So here I go:
Voltage source converters (or VSCs) are converters where the DC side can be considered a constant voltage. There is no relation to how the converter is controlled on the AC side or what sort of functions it offers to the grid.
And it is not just me saying this. Here is a brief collection from power electronics textbooks that I could get my hands on relatively easily:
so in short
STOP USING THE TERM VOLTAGE SOURCE CONVERTER TO DESCRIBE SOMETHING THAT IS NOT …
In February, the Real-time Digital Simulation Laboratory at UNSW Sydney (RTS@UNSW) submitted its comments to the Australian Energy Market Operator’s (AEMO) Draft 2020 Integrated System Plan document, the Draft ISP. Our submission, together with all other submissions to the consultation of the Draft ISP are available in the links below: [1]-[3].
Although the ongoing COVID-19 situation and the anticipated impacts on the broader economy will certainly mean that a lot of the numbers in the assumptions will be revised downwards, it is worth mentioning the main three drivers: i) growth in energy demand, ii) distributed energy resources (DERs) and iii) variable renewable energy (VRE) at utility level. Based on these scenarios, and different sensitivities analysis such as the early retirement of existing brown coal power plants, AEMO identified the following augmentation and new development projects:
Fig 2: Development paths.
The plan looks (or at least looked, 5 months ago) quite reasonable to guide Australia’s energy transition, given what we see today in the Australian network and in networks around the world.
However, we also find that it missed a fair evaluation when considering alternative transmission solutions, particularly those related to DC technologies and the benefits they can offer in the broader system.
For instance when considering transmission upgrades and new transmission paths (with the obvious exception of the MarinusLink where no other alternative exists), several ancillary services that can be provided by HVDC transmission systems (such as frequency stabilization, virtual inertia provision and remote / weak grid connections), have not been explicitly considered in the Draft ISP. As a result, any HVDC alternatives are discarded most of the time only because of what is considered relatively high implementation costs – even when a 1-1 comparison was not done, as was the case with the SA-NSW interconnectors.
The draft ISP, in our view, fails to give a long-term aspirational vision for the network and take into consideration technologies that will make it out of the lab and into the field in the next one to two decades. In less than 20 years we have seen voltage-source converter (VSC) based HVDC systems grow from 100-200MW (at voltages that we now consider “medium” rather than “high”) to the development and successful commercialisation of the multi-GW modular multilevel converter (MMC).
Fig 3: HVDC projects by capacity and transmission line length, 2020. (See how HVDC projects have grown through the years: https://hvdc.shinyapps.io/scatterplot/).
The same way, we anticipate multiterminal DC systems to become a lot more prevalent, allowing integration of small and large scale renewable sources via collector points or multiterminal networks and DC grids. Flagship projects such as the Zhangbei multiterminal system are only the beginning of what can be the fully meshed, DC grids of the future.
Fig 4: Geographical location of Zhangbei four-terminal DC grid (from manuscript “Research on Key Technology and Equipment for Zhangbei 500kV DC Grid”).
It is these kind of forward-thinking and aspirational looks into the Australian Network that we hope to see as part of a scenario in the ISP so that we do not play catch-up with 2010s technologies in the 2040s.
As for our comment on voltages that we now consider “medium” rather than “high”, we will expand on our next post.
Nowadays, a new product or system needs to be tested, tested, and tested again before its launching, and yet it may fail or not achieve the expectations. The energy sector is not the exemption, new technologies have arisen in the last decades to provide greater flexibility and security to the power system. Voltage-source converters or VSCs, cleaner energy (from wind, sunlight and tides), and better monitoring of power system variables (phasor measurement units or PMUs, smart meters) are great examples. However, when failing they may trigger a series of events leading to a blackout (power outage) which may affect essential services, such as hospitals, as well as leaving you without electricity. To integrate these technologies in a smooth manner while minimising adverse effects on power systems, several analyses and studies should be carried out, and here is where proper models and simulations play a major role.
In this context, a simulation can be defined as a representation of a system (or its operation), and several times it entails a mathematical model that describes it. In power engineering, the system is the electric grid and it comprises models of generation, transmission and distribution components such as generators, lines and loads, respectively. Now, the type of model/simulation to use will mainly depend on the power system phenomenon under study (other factors are available information, software and/or hardware).
Power system dynamics can be characterised by their cause, consequence, time frame, physical character, among others. Based on their time frame and physical character the following classification can be made:
Fig 1: Time frame of basic power system dynamic phenomena [1].
where:
Wave phenomena or surges are the fastest dynamics including propagation of electromagnetic waves caused by lighting strikes and/or switching operations;
Electromagnetic phenomena related to machine windings;
Electromechanical phenomena associated with oscillation of machine’s rotating masses; and
Thermodynamic phenomena which compromises slow dynamics such as boiler control actions in steam power plants.
As you can notice,
most of the phenomena are related to traditional rotating machines (phenomena
2, 3 and 4). However, faster dynamics are becoming increasingly significant in
modern power systems due to the integration of large amount of power electronics-based
(or nonsynchronous/asynchronous) generation.
Wind turbines, photovoltaic power plants, battery energy storage systems
and HVDC links and grids interface classical power systems through converters
and inverters which include switching operations. As a consequence, fast
transients and their impact on the grid are gaining more attention than in the
past. However, the smaller the time frame of the phenomena under study, the
more accurate the model should be, which changes the paradigms of how to model
and what platform (software/hardware) should be used.
In phasor-based models (RMS), the sinusoidal voltages and currents are computed as phasors at a particular frequency (grid’s nominal frequency). The network is represented as a complex matrix of impedances (or admittances), which contains linear components, allowing to solve the system’s equations very fast. For classic power systems, which are driven by rotating machines, this representation is good/close enough to analyse the general behaviour of the network (phenomena 3 and 4) and the interaction of its components. Since these models and simulations do not take into account fast transient phenomena, instantaneous electromagnetic transient (EMT) simulations are required. In EMT simulations, differential equations are solve for voltages and currents (ie range of frequencies), enabling the observation and study of fast transient phenomena. In figure 2, the voltage behaviour at the same bus when applying a two-phase to ground fault is shown. In the phasor-based simulation (left) the RMS value is shown, whereas in the EMT one, wave forms of each voltage can be observed. Figure 3 illustrates another example where fast transients are observed when using EMT simulations. As it can be seen, the level of detail (resolution) provided by EMT simulations is higher than in RMS ones.
Fig.2: Voltages for a phasor-based (RMS) simulation (left) and an EMT-based simulation (right).
Fig. 3: Active power for a phasor-based (RMS) simulation (blue) and an EMT-based simulation (red) [2].
…but…there is always a but, is that the time-step (time interval inbetween simulation steps used to solve system equations) required to reproduce EMT phenomena is much smaller than the time-step used to study electromechanical dynamics, which increases the computational power required and the time taken to solve system’s equations (figure 4). So, to put it into perspective, a couple of years ago, AEMO used PSCAD (an EMT software) to run simulations of part of the network, where a 20-second simulation took more than 4 hours to run in a high performance computer (an RMS simulation would have take at most a couple of minutes) [3].
Fig. 4: Number of nodes vs time-step.
Hopefully, an
alternative exists to reduce this burden for EMT simulations: real-time digital
simulations (RTSs). RTSs have risen as powerful tools to obtain an accurate and
reliable representation of the power system in synchronism with a real-time
clock. Some of their advantages are:
It allows you to run an EMT simulation in real time, saving valuable minutes, hours or even days. So, a 20-second simulation will take exactly 20 seconds to run, allowing you to perform more simulations in a shorter period of time and having more time to analyse the results.
Using real-time simulators also allows you to perform power, hardware and control in the loop testing, where the multi-vendor interoperability is possible.
Protection and control schemes can be tested before its commissioning.
It facilitates the integration of renewables by testing digital controllers of power electronics systems.
It may allow you to have a fully representation of the network (digital twin) and support transmission system operators by:
Providing a training platform;
Operating and controlling the system in real-time;
Simulating reliability threats;
Testing operational tactics;
Optimizing load/generation balance;
Analysing cybersecurity.
Finally, I would like to share with you a table which shows the main characteristics of RMS, EMT and RTS-EMT simulation tools [2].
References:
[1] J. Machowski, J. Bialek, and J. Bumby, Power System Dynamics: Stability and Control, 2nd ed. Chichester, West Sussex, UK,: John Wiley & Sons, Ltd., 2010.
[2] F. Arraño-Vargas and G. Konstantinou, “Development of Real-Time Benchmark Models for Integration Studies of Advanced Energy Conversion Systems,” in IEEE Transactions on Energy Conversion. doi: 10.1109/TEC.2019.2939351 (https://ieeexplore.ieee.org/document/8823018)
It provides a
summary of ARENA funded work in the area of energy storage systems across
Australia, specifically the following 4, to a total funding of $100M.
And although the learnings are very interesting at a first reading, I cannot go past some terminology issues that I find quite unclear and will likely create further confusion in the industry.
LSBS instead of BESS or large-scale BESS
This is more of a
personal pet peeve but the literature prefers the terms ESS for energy storage
systems and BESS for battery energy storage systems. So the use if the term
LSBS (Large-Scale Battery Storage) to refer to large-scale BESS (those >5MW
due to AEMO registration purposes) makes me irrationally angry every time I
come across it.
Large-Scale Battery Storage is where you store your big batteries, not a large battery system that stores energy!!!
Is this a large-scale battery storage?
In fact, here is the
search for Large-Scale Battery Storage in Google Scholar:
Here is one for
Battery Energy Storage Systems:
And here is a
shameless plug of our article from 2016 on Power Electronics for BESS:
Wang, G.,
Konstantinou, G., Townsend, C. D., Pou, J., Vazquez, S., Demetriades, G. D.,
& Agelidis, V. G. (2016). A review of power electronics for grid connection
of utility-scale battery energy storage systems. IEEE
Transactions on Sustainable Energy, 7(4),
1778-1790.
On a serious note, here are some instances where the report mentions the term “grid forming” in relation to inverters:
“The ESCRI-SA project is also the first LSBS project in Australia to operate in voltage source mode as a virtual synchronous generator while grid connected (this capability is sometimes known as grid-forming).”
“The project provides seamless islanding of the local network in the event of a network outage. In this case, the LSBS system provides the grid forming functionality and has primary responsibility for maintaining the system voltage and frequency within required limits.”
“Some advanced grid forming inverters now also offer a simulated inertia function (and also some current source inverters with a similar parallel operating mode),”
“In addition to the potential inertia and system strength benefits of grid forming inverters, they can be of particular benefit in a large power system”
” As noted above, grid forming batteries (and some current source batteries with similar parallel operating modes) have the potential to provide simulated inertia.”
Some questions that
immediately pop up based on the above definitions:
Does a grid forming inverter provide virtual inertia?
Can a grid forming inverter be connected to a grid?
Can an inverter provide more than one functionalities?
I find that it is
important to define the terminology appropriately into three rather than two
categories to make appropriate sense of the functionalities. In fact, this was
done in the following article back in 2012:
Rocabert, J., Luna,
A., Blaabjerg, F., & Rodriguez, P. (2012). Control of power converters in
AC microgrids. IEEE transactions on power
electronics, 27(11), 4734-4749.
Grid forming converter. Reference is frequency and voltage and the converter controls frequency and voltage. They serve as the grid (usually in islanded operation) and their goal is to maintain a constant voltage and a constant frequency. A grid forming inverter would have no capacity to emulate inertia or act as a virtual synchronous machine as its reference will remain that of a constant voltage and frequency.
=
Grid feeding inverters. These is the common operation of an inverter in a grid, following a reference for active and reactive power. In a similar manner, these inverters can also regulate the dc side voltage while power flow is controlled by the dc-side, e.g. solar inverters or wind turbine inverters via MPPT.
Grid supporting inverters. These inverters are connected to grid but have the capacity to support grid functionalities by emulating inertia (VSM) which is a form of droop control for generating the active and reactive power references and allowing power sharing between different inverters.
In short:
Grid forming -> Islanded inverter setting voltage and frequency
This is a student post by Xuejian Li, who completed his thesis project for the degree of Master’s of Engineering in the RTS@UNSW Lab in July 2019.
My first experience with real-time
simulations was with the ELEC 9781 (Real-time Digital Simulations) course in
the first semester of 2018. In the class, I first came into contact with both
the RTDS and OPAL-RT real-time simulators and learned how to use them for power
electronics and power systems real-time simulations. Before this, my only
experience was either using software to simulate or build physical circuits for
related experiments. The hardware-in-the-loop real-time simulation part of the
course made me realize that in real engineering applications, testing the
performance of the controller through HiL is a lower cost and more efficient method.
For my thesis project, I worked on implementing HiL testing based on the three-port energy storage system using the Texas Instruments F28379D DSP evaluation board. This was a more complicated topology that typical power electronics converters and required additional familiarization with the power electronics circuit and control as the three-port energy storage system includes energy storage equipment, power grids, and ripple ports. These three parts are connected to the DC bus through a Boost circuit or an H-bridge as on the figure below:
In the final setup, I was able to
demonstrate a fully grid-connected three port system with control hardware in
the loop as shown in the photo below but due to time restrictions I was not
able to implement an effective method for the power change detection of the ripple
port.
Overall, the experience of using real-time simulators broadens my horizons, giving me a deeper understanding of electrical simulations and a preliminary understanding of controller testing methods for practical industrial applications. Also, this experience has provided me with more choices for finding a job. In short, the learning experience at RTS@UNSW Lab is a valuable opportunity for me.
Details on the three-port converter for an energy
storage system can be found in the following article:
Y. Feng, G. Konstantinou, B. Hredzak, J.
Fletcher and K. Sun, “Topologies for Reduction of Second Harmonic Ripple
in Battery Energy Storage Systems,” 2019 IEEE 10th International Symposium on
Power Electronics for Distributed Generation Systems (PEDG), Xi’an,
China, 2019, pp. 414-419.
The preliminary schedule for the 2019 RTDS Australian Users Group Meeting (the first one down-under) was released today. The UGM will take place in Melbourne on the 2nd and 3rd of October.
We are excited as RTS@UNSW to join many of our colleagues from universities and industry across the country with our 3 scheduled presentations,
Two on Day 1:
Real-Time Simulation of Emerging Modular VSC Topologies for HVDC Applications by Dr. Harith Wickramasinghe
Modelling and Simulation of Advanced Energy Conversion Systems for Large-Scale Integration Studies by Mr. Felipe Arraño-Vargas
and a third one on Day 2:
Integration of Solar PV Systems: From Standards Testing to Power Hardware‐in‐the‐Loop functional validation by Dr. Georgios Konstantinou
It was a tweet that sparked the follows a few days ago. A company that attracted external funding of £25 million was going bust. But really, it was not the money, it was the claim of the company to to revolutionize the grid…
… without power
electronics?
Faraday Grid has run out of money months after WeWork CEO Adam Neumann invested £25 million. The startup wanted to "revolutionize" the electric grid. It spent $ on senior hires, offices & acquisitions. More coming on this: https://t.co/avMx061Fwo@TheFaradayGrid@WeWorkAdam
This was quite interesting, as the introduction of the challenges in every FE device reads as an introduction to a paper on Solid State Transformers (SSTs) AKA Power Electronics Transformers (PETs) – Smart Transformers (STs) or however you want to call such a device. There is a lot of ongoing work around the world on SSTs and SSTs are full of power electronics.
On the contrary, the only description of how the device works was offered in this figure at the company website:
And that is all….
Yes, this reads like a patent application and the company has put quite some effort into not revealing what exactly the device is and how it works, but in the end, the plan is to store the energy in “the magnetic flux” and unless you are in a superconductive mode, this is not the most efficient way of storing energy…
Some of the claims
that raise immediate questions simply by skimming though the reports:
Transformation Ratio: The company claimed that a “Faraday Exchanger”, (that was the name of the device, not sure if they were affected by Tesla Inc success in using an inventor’s name as the name of the company) can replace conventional transformers. Yet the basic function of a conventional transformer – voltage transformation – has not been fully demonstrated, a 2:1 ratio is nowhere near the expected level of what a network requires.
Currents. I was quite surprised to see that not a single waveform was shown in any of the reports on the device. I mean, we teach these things to second year undergraduates when introducing three- and four- terminal devices etc. This is also quite important to establish some form of a relation between the input and the output of the device which takes me to the most important point….
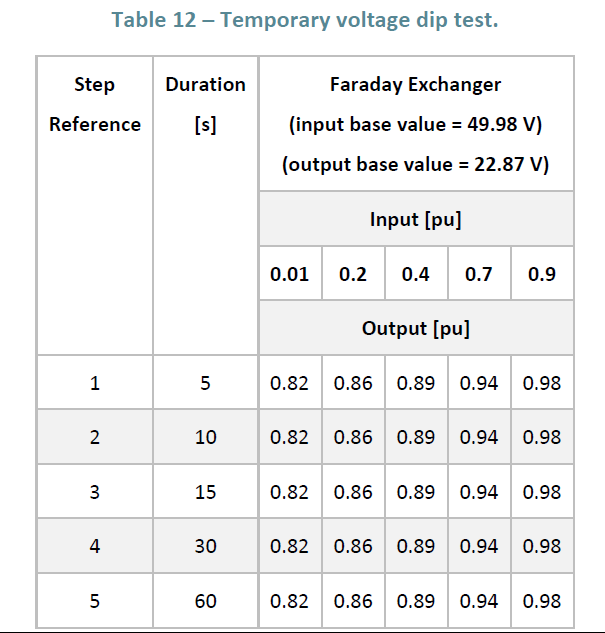
Energy storage capacity. The device was shown that it can compensate momentary and temporary voltage dips as in the table below:
The energy that is not supplied by the input of the device has to be stored somewhere, and this is not infinite. So the ability to scale an FE device without affecting the original claims is based on this value of energy stored – and we have a “relatively good idea” how much can be stored in batteries, capacitors, inductors etc
Harmonics. We can filter out harmonics passively or we can filter out harmonics actively. The measurements below clearly show attenuation of harmonics but no active control. This is also mentioned in the PDNC report, where the result below can be found.
Ignoring that you can use a basic resistor for higher power load emulation and that programmable load of a few kVA are not prohibitively expensive either – a programmable power supply of 10, 20, 50 kVA is not a huge cost – they would be no more than £50k – 100k and that is translating from Australian prices that include our beloved “Australia Tax”!! How is it possible that a company that is able to attract millions of pounds does not own one of the most critical pieces of hardware needed for testing a functional prototype?
Over our three
previous posts, we tried to provide some background in what we think are
critical parts of understanding the Australia to South East Asia
Interconnectors:
In our first post we
summarised previous ideas and proposals that made it out to the public:
Our second post
tried to explain the scale of the proposed projects and the challenges that
need to be considered in terms of transmitted power and the records that need
to be broken in terms of undersea cable distance and depth for these projects
to be i) technically sound and ii) financially viable.
HVDC technology has
progressed a lot in the last 15-20 years with new converter technologies,
grid-friendlier integration to the grid, greater distances, more power, higher
voltages, new cables, true opportunities for multiterminal systems. Even the
notion of a dc-grid is certainly more of a finance issue than a technical
impossibility.
As for connections from Australia to South East Asia, they are probably the most demanding links that we will ever have to construct in land or underwater. These projects are certainly innovative, highly ambitious but at the same time extremely challenging as they push the boundaries of existing technologies. One thing is for sure, when they go ahead (both technically and financially), they will set milestones in HVDC development globally.
There are many aspects that need to be further explored. For example, what are the losses per 1000km in each project (depends on transmission voltage), how losses affect the financial case, reliability of the system (see Basslink cable failure), impact on the Indonesian or Singaporean grid and many others. However, many of these require some deeper analysis and make for interesting projects. In the end we decided to just look at undersea – submarine cables in HVDC interconnectors and the current technology in HVDC cables.
For Further Reading
Two excellent books we can recommend to those who want to read further on HVDC cables (which is outside of our research here at RTS@UNSW) are:
Worzyk, T. (2009). Submarine power cables: design, installation, repair, environmental aspects. Springer Science & Business Media.
and
Mazzanti, G., & Marzinotto, M. (2013). Extruded cables for high-voltage direct-current transmission: advances in research and development (Vol. 93). John Wiley & Sons.
Another resource we can recommend (this time freely available) is the EU Joint Research Center report “HVDC Submarine Power Cables in the World: State-of-the-Art Knowledge” published in 2015 and available at the following link:
Undersea cables have
to carry large amounts of power while “surviving” the harsh
environment that they are placed. For example, placing the cable at deep sea
places substantial mechanical stress while the cable has to also withstand
water pressure and potential damage.
The EU report summarizes very well the requirement for cables in undersea applications. (This is quoted from Zaccone, E., 2009, HVDC transmission cable systems. State of the art and future trends, presentation at Spring 2009 ICC Meeting Subcommittee C – Cable Systems, 17-20 May, 2009 Orlando, USA, however the link to the original report is no longer working).
long continuous lengths
high level of reliability with practical absence of expected faults
good abrasion and corrosion resistance
mechanical resistance to withstand all laying and embedment stresses
minimized environmental impact
minimized water penetration in case of cable damage
Layers of the cable used in the SAPEI HVDC link – currently the deepest and second longest undersea HVDC cable.
Some numbers:
Keeping in mind that
proposed connections to South East Asia need to cover (reported) distances of
2000 to 3800km. the total length of undersea HVDC cables in 2015 was
approximately 8000 km. With the completion of some recent HVDC links (most
notably the UK Western link) a “nice round” number estimation of
10000 km for 2019 would be a good starting point of reference.
The longest one, at 580km, is the NorNed HVDC link between Norway and the Netherlands, which was commissioned in 2007-08. The rated power of the HVDC system is around 700MW at ±450kV and is based on LCC HVDC technology.
After that we have the SAPEI link at 420km (±500kV, 1000 MW, LCC), two of the newest additions in the list, NordBalt HVDC at 400km (±300kV, 700MW, VSC) and the UK Western link at 385km (±600kV, 2200 MW, LCC).
Basslink – the
HVDC link between Tasmania and Victoria would also find itself among the
longest undersea cables. With the undersea part of the cable covering
approximately 290km in the Bass strait (the remaining 80kms are a
combination of overhead lines and underground cables).
The commercial availability an HVDC cable that will be able to accommodate the power, voltage and distances required for a connection to South-East Asia is critical to the success of any project.
Some examples of these cables:
Prysmian has demonstrated 600kV extruded and up to 800kV mass impregnated HVDC cables
The ±600kV UK
Western link is using a pair of the “MI-PPL paper” cables for the
bipole HVDC system.
In the first part,
available here https://rtsunsw.home.blog/2019/07/24/links-to-the-rest-of-the-world/,
we looked back into the Australia – ASEAN HVDC connection history. In this
second part we will try to place the three HVDC projects (WA – Indonesia, NT –
Indonesia and NT – Singapore) within the context of current HVDC technology and
existing HVDC systems.
Firstly, a mention
to our list / interactive infographic on HVDC projects which we will use for a
few of our figures below. At RTS@UNSW we (try to) maintain a list of HVDC
projects starting from 1972 covering all three available technologies
Line Commutated Converters (LCC),
Voltage Source Converters (VSCs), and
The up-and-coming hybrid HVDC connections.
Our list – infographic is available at https://hvdc.shinyapps.io/scatterplot/ where you can find more details about each project, split by technology and country.
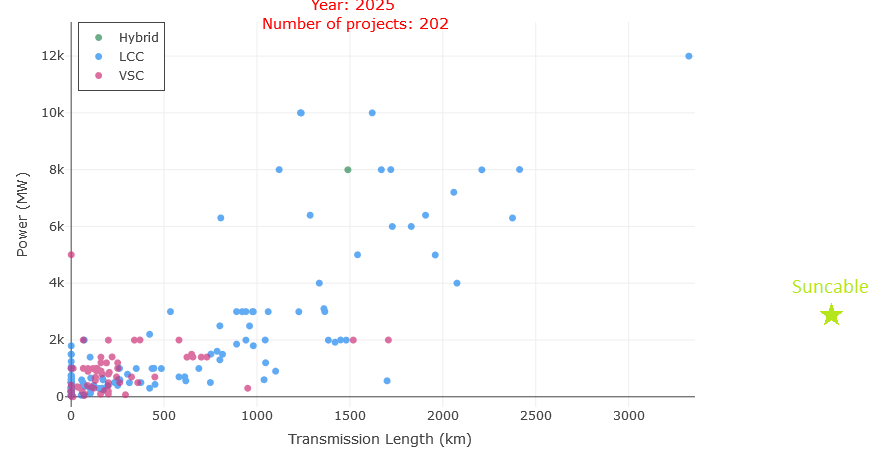
The three proposed “AU-ASEAN” projects share a common target in power capacity which is critical for understanding the remaining parts; 3GW of power to be transferred via underwater cable from NT or WA to either Indonesia or Singapore. The proposals do not go into many details about the specific technology of HVDC, however, the advantages of frequency support and black start capabilities mentioned in the reports hint towards VSC-HVDC solutions.
Back to our list of
HVDC projects. We see that there are currently 10 projects around the 3GW
rating (hovering over each dot will provide further information about each of
these projects). The first observation is that none of these 3GW projects are
based on VSC-HVDC technology – all of them are thyristor based LCC systems.
In terms of age, the oldest dates back to 1985 (commissioned in 1989), the Pacific Intertie Connection – an upgrade of previous links in the West Coast of the US:
The newest and also
longest of the 3GW projects is the Champa – Kurukshetra 1365 km link which was
commissioned a couple of years ago (in 2017, after 5 years of design and
construction) in India. It is a double pole system (2x1500MW) with a
transmission voltage of ±800kV built with overhead lines (OHL). For those who
would like further details on the project, we would suggest the GE report on
the project that was published as a case study:
Or if you have 7 minutes to spend, this video on the project:
So what about VSC solutions?
At the moment,
considering (some but not all) announced projects out to 2025, the highest
rated VSC-based HVDC systems are at 2GW with transmission lengths of
approximately 500 – 700 km. The two standout dots in the plot below are the
Euro-Asia and Euro-Africa Interconnectors. These are designed as multiterminal
systems and the distance represents the total system length rather than
individual sections. They are also still in the planning / design process and
they will probably be operational closer to 2025.
Is transmission length an issue?
The recent BZE
report has a box dedicated to HVDC cables (see below) with the comment that “many thousands of kilometers of HVDC cable are
now in operation”, which we agree but also mentioning that “the
longest being a 3300km line in China with a capacity of 12 gigawatts”
The project
mentioned above in the standout dot on the top right of our HVDC project plot;
the longest and most powerful HVDC project up to date, the 3324km Changji – Guquan
link, an Ultra High-voltage (UHVDC) link at ±1100kV. This project is so unique
at this day that nothing else even comes close; some of the “shorter”
again UHVDC links reaching transmission distances of up to 2500 km.
The caveat? The Changji – Guquan project, as is the case with every other UHVDC system (any system that operates at voltages ±800kV and above), is built using overhead lines and not HVDC cables. At ±1100kV, the scale of the transmission towers to provide the necessary clearance and traverse the landscape is so such that we thought we needed to share a video to appreciate it better (worth the watch):
Where does this
place the proposed projects? The links to Indonesia have different starting and
finishing points in Australia and at the other end but current estimations are
of a transmission distance of approximately 2000km. On the other hand, the Suncable
to Singapore is estimated at 3800km, which means it does not fit in our current
chart and we have to place it outside the length axis.
What about depth?
Linking to ASEAN is not only a transmission distance issue but is greatly affected by the water depth. The depth will obviously depend on the path that is chosen with shorter direct routes less preferable because of the deeper seabed. Even the less direct routes typically route the cable through depths of ~2000m (also refer to the CIGRE global grid study we mentioned in part 1). Although technically possible based on the technical specifications of HVDC cables provided by cable manufacturers, at this moment we have only three cases of underwater HVDC cables lain below 1000m, i) GRITA, the Greece – Italy HVDC link at around 1km, ii) the link between mainland Spain and Mallorca (~1450m) and iii) the deepest of all, the SAPEI connection between Italy and Sardinia at ~1650m. The SAPEI link is also the longest of them at approximately 450km.
And because you can find a YouTube video for everything, here is one from the installation of the SAPEI cable:
One last note:
The BZE report which
comments that “This type of long-distance
transmission is becoming more viable thanks to the decreasing cost of High
Voltage Direct Current (HVDC) cables.60“
Reference 60 in the
report is, in fact, the Energy Networks
Australia and CSIRO, 2016. Electricity Network Transformation Roadmap: Key
Concepts Report. This report, that is available in the link below, does
not make any reference to HVDC cables or HVDC technologies https://www.energynetworks.com.au/sites/default/files/key_concepts_report_2016.pdf
As the HVDC cable is
the single most critical component of underwater HVDC transmission –
acknowledged by Suncable itself
“But he says the major transformation that makes
the farm possible is the advent of high-voltage, direct-current submarine
cable, which he describes as the “greatest unsung technology development”. Sun
Cable’s underwater link to Singapore will run 3,800km. “It is extraordinary
technology that is going to change the flow of energy between countries. It is
going to have profound implications and the extent of those implications hasn’t
been widely identified,” Griffin says.”
For this reason, we have decided to spend a third post exploring HVDC cables and looking in depth at a 2015 EU publication on HVDC cables.